Introduction
Some time ago I wrote about DNS privacy, why it’s important and how to ensure noone is snooping on your DNS traffic and protect yourself using techniques such DNS over HTTPS and DNS over TLS.
To visualize the impact of non-secured DNS traffic, I setup a small monitoring environment using OpenWRT, Prometheus and Grafana. Getting this setup to work on a single core router with 2MB storage was more difficult than expected…
Logging DNS traffic on OpenWRT
I recently brought my OpenWRT router to my other home where I have an ISP-provided router. The network setup looks something like this:
The OpenWRT box is a TP-Link TL-WDR4300 v1 which I bought many years ago and oddly enough it’s still one of the best devices supported by OpenWRT.
I use dnsmasq for DHCP and DNS.
Looking at the dnsmasq man page, there is the --log-queries flag (logqueries '1' in /etc/config/dhcp) which makes dnsmasq log all DNS queries it makes.
Config looks like
option logqueries '1'
Example logs:
Sep  3 15:54:12 dnsmasq[19690]: 3689 192.168.2.198/52226 query[A] google.com from 192.168.2.198
Sep  3 15:54:12 dnsmasq[19690]: 3689 192.168.2.198/52226 forwarded google.com to 10.0.20.1
Sep  3 15:54:12 dnsmasq[19690]: 3690 192.168.2.198/52226 query[AAAA] google.com from 192.168.2.198
Sep  3 15:54:12 dnsmasq[19690]: 3690 192.168.2.198/52226 forwarded google.com to 10.0.20.1
Sep  3 15:54:12 dnsmasq[19690]: 3689 192.168.2.198/52226 reply google.com is 216.58.208.206
Sep  3 15:54:12 dnsmasq[19690]: 3690 192.168.2.198/52226 reply google.com is 2a00:1450:4010:c0d::8b
Sep  3 15:54:12 dnsmasq[19690]: 3690 192.168.2.198/52226 reply google.com is 2a00:1450:4010:c0d::66
Sep  3 15:54:12 dnsmasq[19690]: 3690 192.168.2.198/52226 reply google.com is 2a00:1450:4010:c0d::64
Sep  3 15:54:12 dnsmasq[19690]: 3690 192.168.2.198/52226 reply google.com is 2a00:1450:4010:c0d::8a
By default this is logged to syslog. My home network has ~10 devices, each of which constantly makes DNS requests. Logging everything to syslog would wreck the flash storage of the router quite fast.
Flash storage devices have ~10_000 - 100_000 write cycles. Staying on the pessimistic end, 10_000 write cycles times 2 MB of available capacity means that after around 20GB of written data the flash storage will be dead and since we can’t replace it, the router will be useless as well.
This means logging all requests to syslog is not an option.
What about tmpfs?
We could use tmpfs to write to memory instead of to disk. Memory isn’t write-limited so this looks promising.
Looking at the dnsmasq man page once again, there is a --log-facility=facility (logfacility 'facility' in config) option which defines a different log facility than syslog.
Adding the following line to /etc/config/dhcp
option logfacility '/tmp/dnsmasq.log'
instructs dnsmasq to redirect all logs (including the dns queries) to /tmp/dnsmasq.log
Cool, we have a stream of logs going to a place which won’t suffer from too many writes. Let’s see how to to consume this stream.
Consuming logs
The place where I want to store the information is a Prometheus instance I already have setup. This means we’ll need a prometheus exporter of some kind.
There is an OpenWRT prometheus exporter which has quite a few useful scripts. Sadly, there isn’t a DNS exporter so this means we’ll have to write one.
Writing an OpenWRT Prometheus exporter
Okay, where do we start?
Well, the prometheus exporter is started with /etc/init.d/prometheus-node-exporter-lua start so let’s see what’s in this script.
Looking through the script, the main section has an interesting bit of code:
col_mods = {} -- <- global variable
col_names = {}
ls_fd = io.popen("ls -1 /usr/lib/lua/prometheus-collectors/*.lua")
for c in ls_fd:lines() do
  c = c:match("([^/]+)%.lua$")
  col_mods[c] = require('prometheus-collectors.'..c)
  col_names[#col_names+1] = c
end
ls_fd:close()
This section finds all lua files in /usr/lib/lua/prometheus-collectors/ and registers them in the col_mods map.
The lua exporter starts a web service with the following callback:
function serve(request)
  local q = request:match("^GET /metrics%??([^ ]*) HTTP/1%.[01]$")
  if q == nil then
    http_not_found()
  else
    http_ok_header()
    local cols = {}
    for c in q:gmatch("collect[^=]*=([^&]+)") do
      cols[#cols+1] = c
    end
    if #cols == 0 then
      cols = col_names
    end
    run_all_collectors(cols)
  end
  client:close()
  return true
end
The interesting bit is run_all_collectors, let’s look at that:
function run_all_collectors(collectors)
  local metric_duration = metric("node_scrape_collector_duration_seconds", "gauge")
  local metric_success = metric("node_scrape_collector_success", "gauge")
  for _,cname in pairs(collectors) do
    if col_mods[cname] ~= nil then
      local duration, success = timed_scrape(col_mods[cname])
      local labels = {collector=cname}
      metric_duration(labels, duration)
      metric_success(labels, success)
    end
  end
end
It seems that the timed_scrape is what runs the collector.
Let’s see what it does:
function timed_scrape(collector)
  local start_time = socket.gettime()
  local success = 1
  local status, err = pcall(collector.scrape)
  if not status then
    success = 0
    print(err)
  end
  return (socket.gettime() - start_time), success
end
The timed_scrape function accepts a collector (object?) which must provide a .scrape method.
Lua is a dynamic language which utilizes duck typing. Let’s look at some of the files in the collectors directory to see how they look like.
The contents of /usr/lib/lua/prometheus-collectors/time.lua:
local function scrape()
  -- current time
  metric("node_time_seconds", "counter", nil, os.time())
end

return { scrape = scrape }
Okay, fairly simple - there is a return statement which must provide a scrape key which is called by the timed_scrape function we saw earlier.
Looks like we just need to create a .lua file, place it in the collectors directory and it will be automatically be picked up by the exporter service.
Cool, let’s write our own exporter in lua:
-- /usr/lib/lua/prometheus-collectors/dnsmasq.lua

local function scrape()
   ...
  end
end

return { scrape = scrape }
Linking dnsmasq with the lua exporter
Now, we know how to create a prometheus exporter and we know how to get the raw data from dnsmasq. The next step is to write some logic to parse the raw log and make it consumable by the exporter.
Before starting to implement, let’s see what data we want to collect
Requirements
- collect source of the DNS query
- collect requested domain
- ? type of query
We want to collect who queried what. For starters, let’s create a histogram of who queried what and how many times.
Turning this
Sep  3 15:54:12 dnsmasq[19690]: 3689 192.168.2.198/52226 query[A] google.com from 192.168.2.198
Sep  3 15:54:12 dnsmasq[19690]: 3689 192.168.2.198/52226 query[A] facebook.com from 192.168.2.198
Sep  3 15:54:12 dnsmasq[19690]: 3689 192.168.2.199/52226 query[A] github.com from 192.168.2.199
Sep  3 15:54:12 dnsmasq[19690]: 3689 192.168.2.199/52226 query[A] github.com from 192.168.2.199
into
| Client | Host | # |
|---|---|---|
| 192.168.2.198 | google.com | 1 |
| 192.168.2.198 | facebook.com | 1 |
| 192.168.2.199 | github.com | 2 |
Tech stack
We have a single core router, which needs to handle ~2-3 QPS (dnsmasq log lines) with spikes.
Lua?
We could do this in lua on each scrape call
- read
/tmp/dnsmasq.log - parse each line (filter only type A queries, extract hosts and clients)
- build histogram and return values
I’m not a lua expert and tbf the language seemed a bit strange with not too many built-in functions. Furthermore, the log file will contain an increasing number of lines and processing everything in lua may be a bit too much.
So lua is out, what else?
Python?
root@OpenWrt:~# python
-ash: python: not found
root@OpenWrt:~# python3
-ash: python3: not found
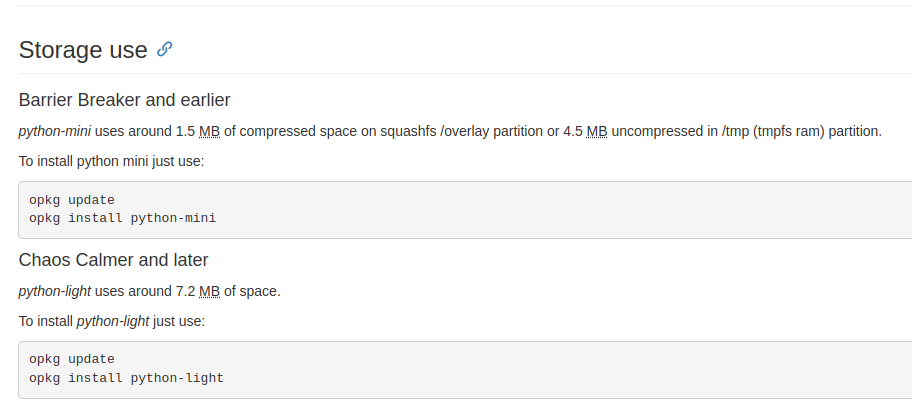
The 7.2 MB python-light is out of the question.
Looking at the available storage on the router:
root@OpenWrt:~# df -h
Filesystem                Size      Used Available Use% Mounted on
/dev/root                 2.5M      2.5M         0 100% /rom
tmpfs                    60.8M      6.0M     54.8M  10% /tmp
/dev/mtdblock4            3.9M      2.8M      1.0M  73% /overlay
overlayfs:/overlay        3.9M      2.8M      1.0M  73% /
tmpfs                   512.0K         0    512.0K   0% /dev
With 1 MB available even the python-mini cannot fit so Python is also not an option :/
Something External?
I have a spare raspberry pi which could do this computation and expose it somehow. But I don’t like moving this out of the OpenWRT router as it adds an unnecessary dependency - if the pi is down the DNS collection is also down which is not ideal.
awk?
root@OpenWrt:~# awk
BusyBox v1.30.1 () multi-call binary.

Usage: awk [OPTIONS] [AWK_PROGRAM] [FILE]...

        -v VAR=VAL      Set variable
        -F SEP          Use SEP as field separator
        -f FILE         Read program from FILE
        -e AWK_PROGRAM
Okay, awk is good exactly for text processing which is essentially what we want to do.
My knowledge of awk is very limited. I found this very interesting AWK tutorial. I’d highly recommend going through it if you’re also an AWK n00b.
Let’s start writing out dnsmasq.lua script.
We want to produce something easy to consume from within the lua scraper. A CSV-like format would be a good fit.
Something like
client_name,domain,number_of_requests
So let’s set the output file separator (OFS), init the clients associative array and init the output string:
#!/usr/bin/awk -f

BEGIN {
OFS = ",";     # output fields separated by comma
clients[]="";  # histogram of client,domain pairs to number of visits
output="";     # string output which will be built from the histogram and dumped to a file
}
Next, we want to process only lines which are DNS type A requests. An example log line we want to process:
Sep 3 15:54:12 dnsmasq[19690]: 3689 192.168.2.198/52226 query[A] google.com from 192.168.2.198
We can do this with a simple filter, and then init some variables for the fields we are interested in like this:
$7 == "query[A]" {
host = $8;
src = $10;
Next, we want to increment the count this $src has requested $host.
Our data format looks something like:
Map<src: string, Map<host: string, number of visits: int>>
This is where things become messy as AWK does not support nested maps.
The recommended way is to have 2 string keys concatenated. So we can have something like
clients[src, host]++;
This creates a key formed from src + SUBSEP + host.
Later on, we can split the map key by SUBSEP and extract back the src and host elements.
Now to print the values, we’d need to iterate the map, split out the combined key and print out the value:
for (s_host in clients) {
    split(s_host,sep, SUBSEP)  # split combined key
    # Check if the line is non-empty
    if (clients[sep[1], sep[2]] != "") {
      output = output sep[1] "," sep[2] "," clients[sep[1], sep[2]] ORS
    }
 }
 print(output)
We can run this script with
./dnsmasq.awk < /tmp/dnsmasq.log

192.168.2.198,www.facebook.com,1
192.168.2.100,client-channel.google.com,1
Streaming
So far so good, however this is a one-off script. This means that the awk script reads the dnsmasq log file, processes it and exits. Starting this script constantly would be expensive and a waste of resources.
Instead, why not have it read from the log constantly, update it’s internal state and periodically dump it somewhere so that the exporter can use it?
Okay, but for that to work, we’ll need an “endless” file that the awk script can read. Well, named pipes spring to mind.
We can have dnsmasq’s logfacility to be a named pipe, which is opened on the other end by the AWK processor.
Something like this:
This works, but we have to be careful as the write to the named pipe is blocking so if we start dnsmasq without having the pipe open in read mode, the dnsmasq process blocks and does not start at all.
Communication
Next, we need communication between processes. We need the dnsmasq exporter to somehow signal the awk script to dump it’s state so it can be read by the exporter.
Now, how can we make processes communicate? Signals, you may think and that’s a good option. However AWK is build for text processing, not signal handling and hence it doesn’t support handling signals.
We could use some other signal file mechanism, such as
- from the lua exporter, create a “signal” file
- from the awk script, for each read line, check if this “signal” file exists
- if it does, dump state somewhere and remove the “signal” file
- if not, just update internal state
But now how would you know that the awk script has finished dumping it’s state so that it’s ready to be read? Yes, we could add some artificial delay in the lua script but that’s horrible and unreliable…
Let’s keep things simple for now and dump the awk state every time a new line is read.
Stitching everything together
This is how the workflow looks for now:
- Prometheus calls the OpenWRT lua exporter
- The lua exporter calls the dnsmasq exporter’s
scrapefunction - The
scrapefunction reads the already parsed contents produced asynchronously by the awk processor and returns the result
The completed lua script looks like this:
local function scrape()
   dns_a_metric = metric("dns_a_request", "counter") -- prints prometheus boilerplate for this metric
   for line in io.lines('/tmp/dnsmasq.log.parsed') do
      src, host, times = line:match("([^,]+),([^,]+),([^,]+)")  -- extract csv values
      local labels = {}
      labels["src"] = src
      labels["host"] = host
      dns_a_metric(labels, times) -- print labels with values
   end
end

return { scrape = scrape }
Asynchronously, we have the AWK processor script parsing lines and constantly dumping them to /tmp/dnsmasq.log.parsed file.
The dnsmasq.awk script is the same with the exception we need to redirect the print(output) to a file.
AWK provides a shell-like redirection with the > operator so we could do
print(output) > /tmp/dnsmasq.log.parsed
There’s one detail though - this redirection overwrites only on the first occurrence. Subsequent writes to this file get appended which is not what we want - we need each write to overwrite the contents and have only the latest values.
To do that, I came up with this nasty hack:
report = "cat > \"/tmp/dnsmasq.log.parsed\" "
print (output) | report
close(report)
where the close call is crucial for closing the write connection so that subsequent writes overwrite the content.
The workflow for the AWK processor is something like:
- Listen for lines from the fifo which is populated by the dnsmasq service
- For each line, extract src, host and increase the count for that combination
- dump the state to the parsed file in a csv format
This visualization may help:
And this works!
Looking through the parsed file, it gets populated with new entries in csv format, curl-ing the exporter we can see values such as
# TYPE dns_a_request counter
dns_a_request{host="gsp51-ssl.ls.apple.com",src="192.168.2.11"} 1
dns_a_request{host="calendar.google.com",src="192.168.2.11"} 1
dns_a_request{host="www.googleadservices.com",src="192.168.2.11"} 2
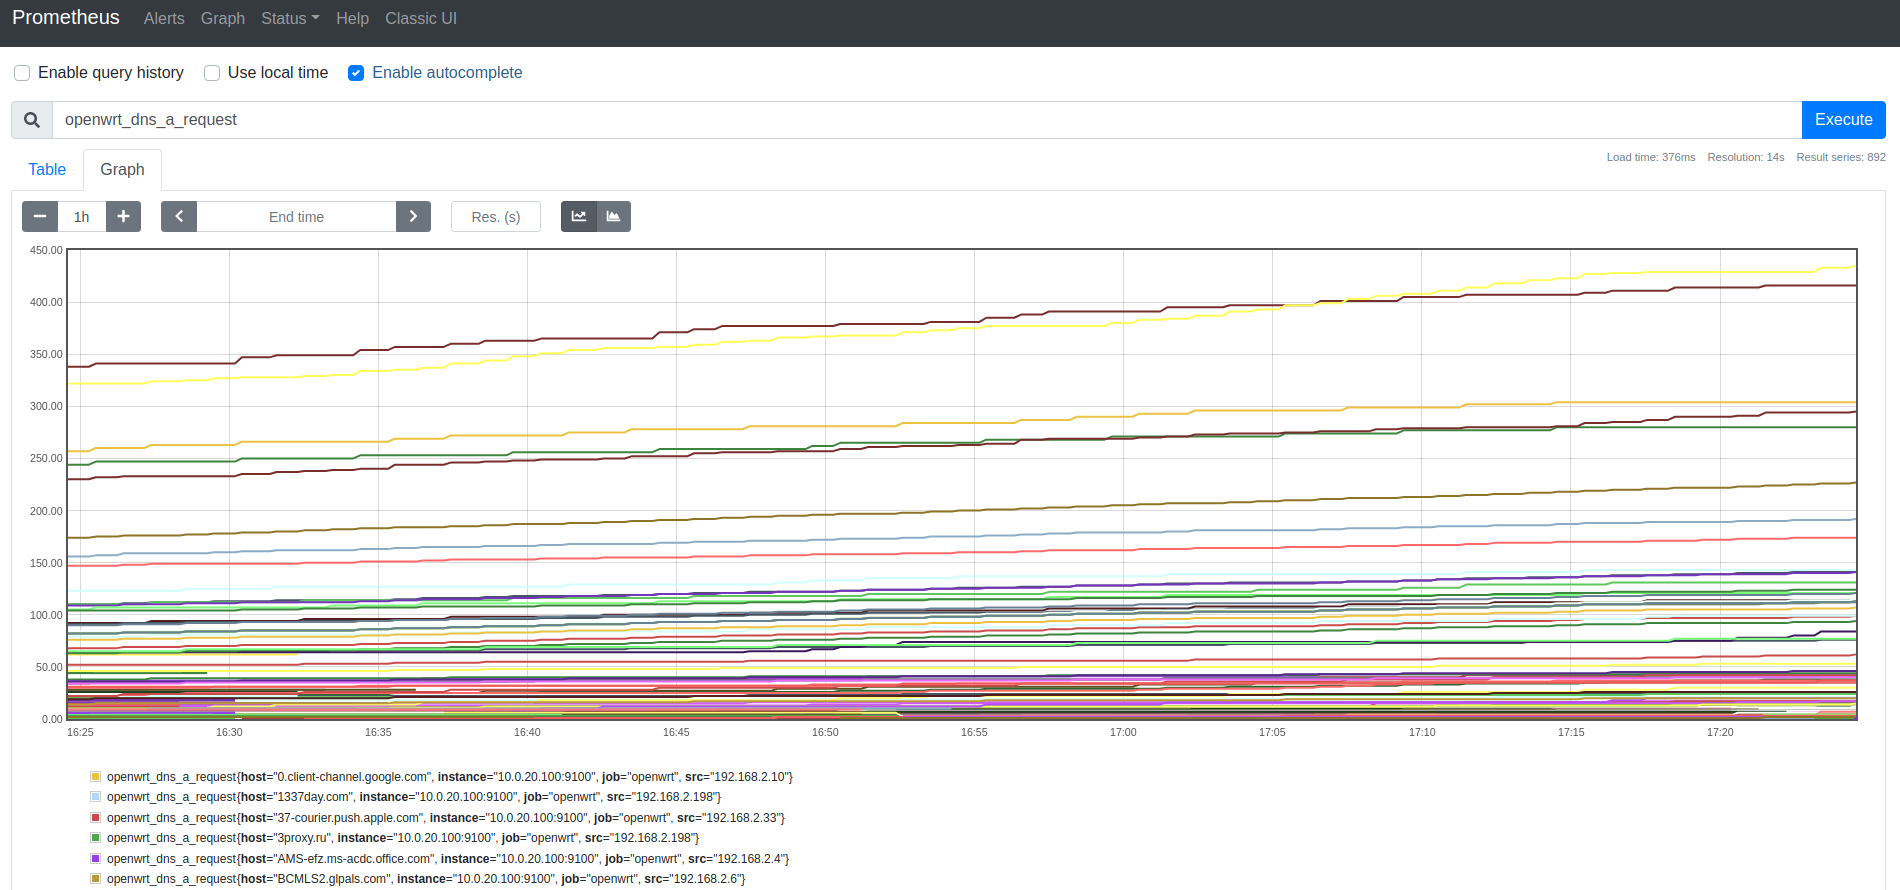
Going to the prometheus UI and querying for our metric type returns all the values exactly how we want them:
However…
After a few hours , the internet connections dies out.
ssh-ing into the router shows a concerning picture:
root@OpenWrt:~# uptime
 15:36:14 up 1 day,  3:34,  load average: 1.12, 1.05, 1.09
That’s a single core router which a load average of 1.12 which is quite bad…
Inspecting the processes consuming CPU time shows that the awk script is eating it all.
And it does make sense, for each dns query line that dnsmasq produces, the awk script iterates through all known connections (which are unlimited) and finds the one to increment. Obviously at some point the known client-domain pairs will become too many for the single core to handle and hence this situation.
Optimization
Now for the fun part, the script we have so far works but needs to be optimized so that it can work on the very limited resources that the router has.
A tl;dr of what the awk script does for each line that dnsmasq service sends to the fifo:
The blocks in red the problematic ones:
- Creating new entries is currently unbounded. This means memory usage will go up as more client-domain pairs are logged.
- Dumping internal state iterates through all entries, appends them to a string and writes this string to a file. As we have more and more entries, iterating them becomes cumbersome and CPU hot.
Attempt 1 of reducing CPU usage
CPU was very hot because for every type A request, all entries had to be iterated and dumped into a file.
Logging every N requests
One simple way to solve this is to log to the file every N requests.
But how would we pick a proper N?
We can set N = 10 and this would help.
But when the network is busier we’d have quite a few requests so 10 won’t be enough…
Okay, how about N = 100 or more?
That’s going to help when the network is busy, however, when there’s not as much traffic it will take very long to generate enough request so that the log file is updated.
Ideally we want real-time updates to the log file so the prometheus collects accurate data.
Static N won’t work…
Apparently N needs to be dynamic.
Okay, what’s a good indicator of how busy the network is?
Time could be one - during the day the network is going to be more busy than at night. Still, that’s going to need some manual tuning all the time so probably not as good.
How about logging every N seconds? Perhaps we could have a separate thread which will signal once a timer times out and then we can log.
Sure, but how do you run threads in awk? If you find a way, please let me know…
Attempt 2 of reducing CPU usage
Reducing the number of entries
Reducing how much src-domain pairs the script stores will help by both reducing the amount of memory the script uses as well as having less entries to iterate when dumping the state will reduce CPU usage.
One way to do this is by implementing a fifo queue - once we hit N number of entries we can start deleting entries from the front. The issue with this approach is that we can have duplicates:
-> [(laptop, facebook.com, 1), (phone, google.com, 1), (raspberry, github.com, 2), (laptop, facebook.com, 2)] ->
This means that even if the pair (laptop, facebook.com) is hot, we will still delete it which is not good.
LRU in awk
Another approach is implement LRU cache. We can implement a fifo queue which tracks which entries have been least recently used and delete those.
So we’ll have a “map” which stores the clients-domain pairs and the number of requests and another “map” which stores when was each entry last used.
The annoying part is that AWK does not have any data structures beyond associative arrays which don’t guarantee order. After spending a few hours trying to implement various indexing strategies and fighting with the quirks and limitations of awk I decided to rethink the approach.
Taking a step back
AWK turned out to be a big pain implementing LRU and the gain didn’t seem very optimistic.
It was already becoming the early hours of the night and my frustration with AWK was growing ever more. AWK is a fun language but the use case seems like it was not a good fit for it. Python was not possible to download because the flash storage on the router is quite limited, however, there is something else we could do - cross compilation.
Aha! Why not use a compiled higher level language like Go, cross compile the binary and use that?
Let’s GO
Let’s see if we can run Go on the router.
Building the hello world of go
package main

import "fmt"

func main() {
	fmt.Println("hello")
}
Let’s see what’s the architecture:
root@OpenWrt:~# cat /proc/cpuinfo
system type             : Atheros AR9344 rev 2
machine                 : TP-Link TL-WDR4300 v1
processor               : 0
cpu model               : MIPS 74Kc V4.12
BogoMIPS                : 278.93
wait instruction        : yes
microsecond timers      : yes
tlb_entries             : 32
extra interrupt vector  : yes
hardware watchpoint     : yes, count: 4, address/irw mask: [0x0ffc, 0x0ffc, 0x0ffb, 0x0ffb]
isa                     : mips1 mips2 mips32r1 mips32r2
ASEs implemented        : mips16 dsp dsp2
Options implemented     : tlb 4kex 4k_cache prefetch mcheck ejtag llsc dc_aliases perf_cntr_intr_bit nan_legacy nan_2008 perf
shadow register sets    : 1
kscratch registers      : 0
package                 : 0
core                    : 0
VCED exceptions         : not available
VCEI exceptions         : not available
Luckily, Go supports MIPS architecture, let’s build the program:
GOOS=linux GOARCH=mips go build main.go && scp main openwrt:/tmp/
and run it
root@OpenWrt:~# /tmp/main
Illegal instruction
root@OpenWrt:~#
That’s not good.
After a bit of searching, I came across this blog post which suggested adding GOMIPS=softfloat to the build line.
Okay let’s try it again:
GOOS=linux GOARCH=mips GOMIPS=softfloat go build main.go && scp main openwrt:/tmp/
Running it this time
root@OpenWrt:~# /tmp/main
hello
root@OpenWrt:~#
Success!
Size does matter…
╰─$ du main -sh
1.9M    main
That’s almost 2MB only for a single print :/ This means there’s no way we can store the binary on the flash storage.
Maybe we can compress it somehow?
Welcome to upx:
╰─$ upx --ultra-brute -9 main
                       Ultimate Packer for eXecutables
                          Copyright (C) 1996 - 2020
UPX 3.96        Markus Oberhumer, Laszlo Molnar & John Reiser   Jan 23rd 2020

        File size         Ratio      Format      Name
   --------------------   ------   -----------   -----------
   1986112 ->    859056   43.25%   linux/mips    main

Packed 1 file.
40% compression, not bad!
Luckily we have nearly 60MB of tmpfs so we can use that to store the binary and source it from somewhere if it goes missing.
So we can either compress the binary enough so that it fits on flash, or fetch the binary every time it’s needed. That should be good enough for now.
Let’s get into the juicy stuff of writing Go!

Going to Go from AWK was such a pleasant experience!
With a few custom structs, and a few for-loops we already have everything we need for logging.
And in fact, why write to a file in the first place? We can have a web handler which exports all the metrics in a csv format so the lua prometheus scraper can consume this.
Implementing LRU in GO is so much easier. We can have different goroutines for the web handler and for the log parser. We have channels to pass values between goroutines.
Pure joy :-)
The final code can be found in this repo.
Now we can make the lua script read the csv values from a web endpoint instead of a local file. Here’s what the final script looks like:
local function scrape()
  local http = require("socket.http")
  local body, code, headers, status = http.request("http://127.0.0.1:9101/")
  dns_a_metric = metric("dns_a_request", "counter")
  for lines in body:gmatch("[^\n\r]+") do
          src, host, times, client_mac, client_hostname, client_uid, client_lease_expiration = lines:match("([^,]+),([^,]+),([^,]+),([^,]+),([^,]+),([^,]+),([^,]+)")
          local labels = {}
          labels["src"] = src or ""
          labels["host"] = host or ""
          labels["client_mac"] = client_mac or ""
          labels["client_hostname"] = client_hostname or ""
          labels["cliend_uid"] = client_uid or ""
          labels["client_lease_expiration"] = client_lease_expiration or ""
          dns_a_metric(labels, times)
  end
end

return { scrape = scrape }
I have added a bit more functionality to the Go dnsmasq exporter such as reading the active dhcp leases so we can match the client hostname with a dns request. This removes the need to mapping MAC addresses or setting static IPs.
Here’s a line (with a comment explaining the format) of the Go exporter:
# IP address, query domain, # times this domain was requested, dhcp hostname, dhcp uid, dhcp lease expiration time
192.168.3.4,www.netflix.com,2,<anonymized mac>,viktorbarzin-laptop,<anonymized dhcp uid>,1631442847
Here’s what the final data workflow looks like:
Deploying
Deploying is a simple as getting the binary into tmpfs and running it. A bash script to check if the exporter is running and downloading it if missing simulates a “service”-like behaviour.
#!/bin/sh
set -e

if netstat -tlnp | grep 9101 > /dev/null; then
  echo dnsmasq exporter is listening
else
  cd /tmp

  set +e
  rm main.gz
  rm main
  set -e

  wget https://github.com/ViktorBarzin/openwrt_dnsmasq_exporter/raw/main/main.gz -O /tmp/main.gz

  gzip -d main.gz
  cd -

  chmod +x /tmp/main

  # Need to restart dnsmasq to ensure it's writing to the tmp fifo instead of syslog
  /etc/init.d/dnsmasq stop
  /tmp/main | logger -t dnsmasq_exporter &
  /etc/init.d/dnsmasq start
fi
echo Done
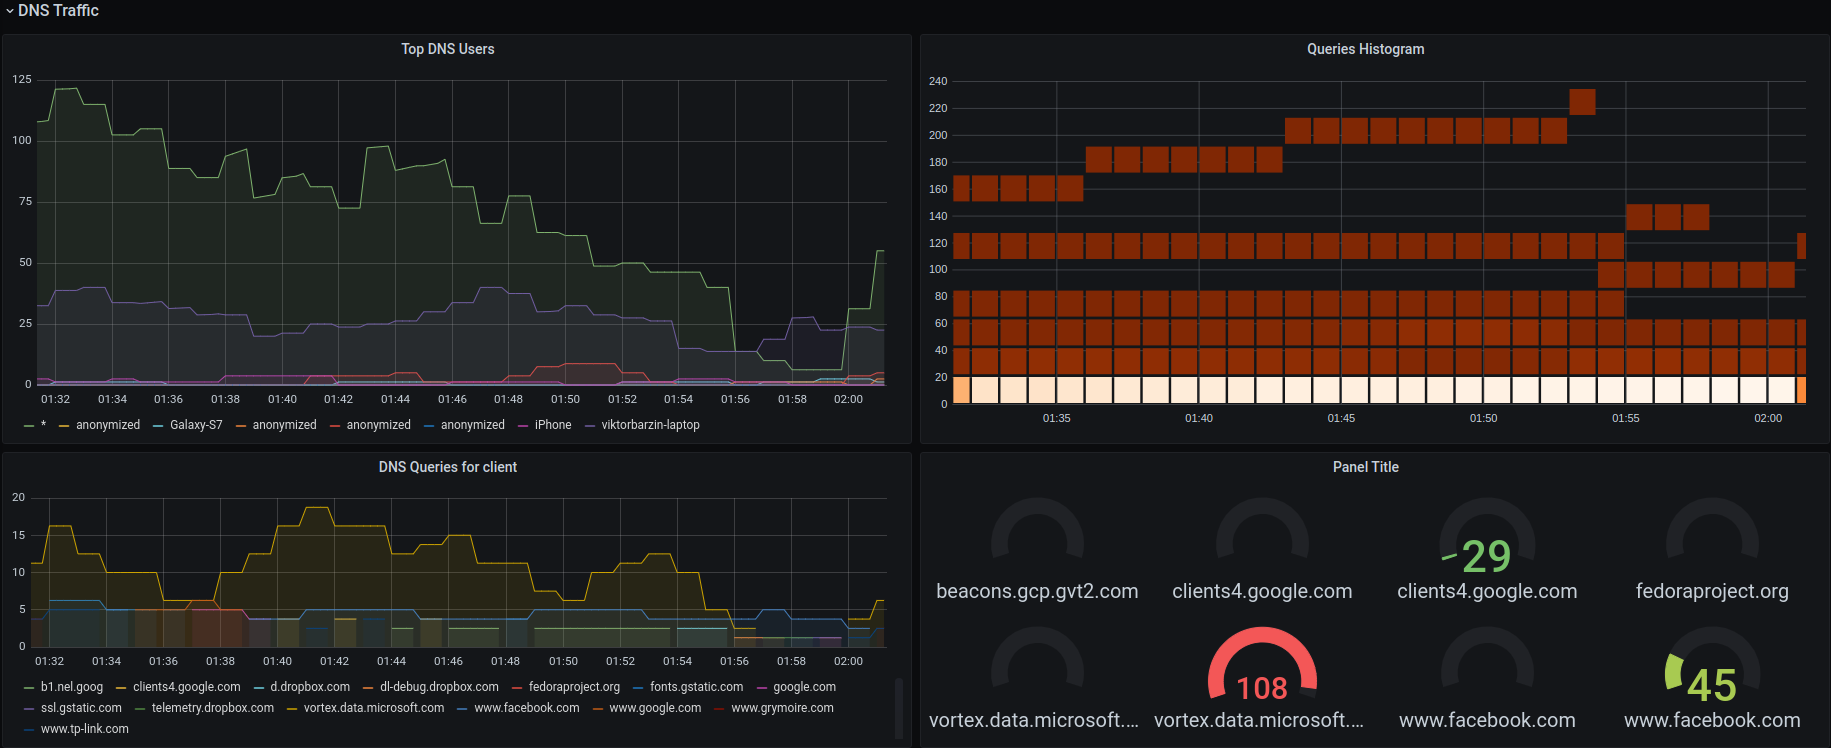
Having all of this information collected, allows to build very beautiful dashboards on top. I added this section to my OpenWRT dashboard showing the top DNS users, and optionally filtering by hostname:
Conclusion
In closing, I hope this shows the importance of DNS privacy and why you should be extremely careful to what networks you connect and how you use them.
Some tips on my end on how to regain your privacy when connecting to public/insecure networks:
- Setup your own VPN - all you need is a raspberry pi, wireguard and 30 min of your time
- Setup DNS over HTTPS clients on your machine or better yet, make your DNS server on the VPN use DoH. Have a look at this post for more info
This was an utterly joyful journey for myself where I learnt few fun bits such as lua, prometheus exporters on OpenWRT, AWK, optimizing AWK, cross compiling Go.
Thanks for reading and see you next time :-)
Resources
External resources:
- Using
group()aggregator in PromQL - OpenWRT Prometheus Exporters
- OpenWRT Prometheus Exporter
conntrackmoduleconntrack-toolspackage- iptables log targets
- logging dnsmasq requests with awk
- lua posix signals
- prometheus metric types
- Lua file I/O
- How to read data in lua
- Lua split by comma
- Named pipes in GNU OS
- Names pipes with multiple readers
- Lua domain sockets
- dnsmasq man page
- running external programs in AWK
- AWK Tutorial
- AWK output separators
- AWK redirecting
printfoutput - AWK getting current date using random seed
- AWK toggle boolean value
- UPX
- GO splitting by whitespace