Introduction
This time round, I’ll share my experience with Security Onion and the journey of setting it up in my environment.
I will skip the dull installation process (everyone can click next at the prompts) and rather show you how it fits in my increasingly complex network topology. The focus of this blogpost will be on the interconnection between pfSense, VMWare ESXi and Security Onion.
Prerequisites
Before reading further on, I’d recommend familiarizing yourself with pfSense and the awesome stuff it can do. Also, knowing what VMWare ESXi hypervisor is having a bit of knowledge on the networking part would be beneficial.
If you’ve never heard about Security Onion before:
Security Onion is a free and open source Linux distribution for intrusion detection, enterprise security monitoring, and log management. It includes Elasticsearch, Logstash, Kibana, Snort, Suricata, Bro, Wazuh, Sguil, Squert, CyberChef, NetworkMiner, and many other security tools.
– Security Onion’s website
I am going to show you how it all fits in my lab so let’s get started!
P.S: This is not intended to be a guide, rather it’s the path I took to get it done. If you need a guide or help, pm me somewhere.
How I did network monitoring so far
Previously, I monitored my network with a mix of an ELK stack VM that collects and analyzes the pfSense firewall logs along with the firewall logs on my OpenWRT router at home.
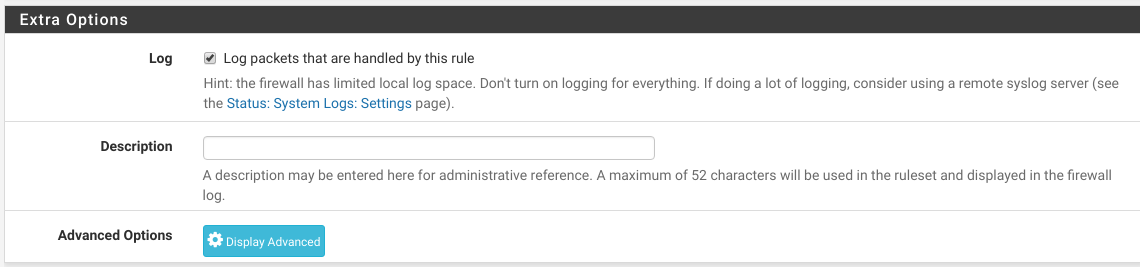
Cool thing about pfSense’s firewall is that you can explicitly say which rules you’d like to log by ticking the Log checkbox in the rule’s page:
Furthermore, you can forward these logs to an external log server (in my case Logstash) via Status > System Logs > Settings > Remote Logging Options like so:
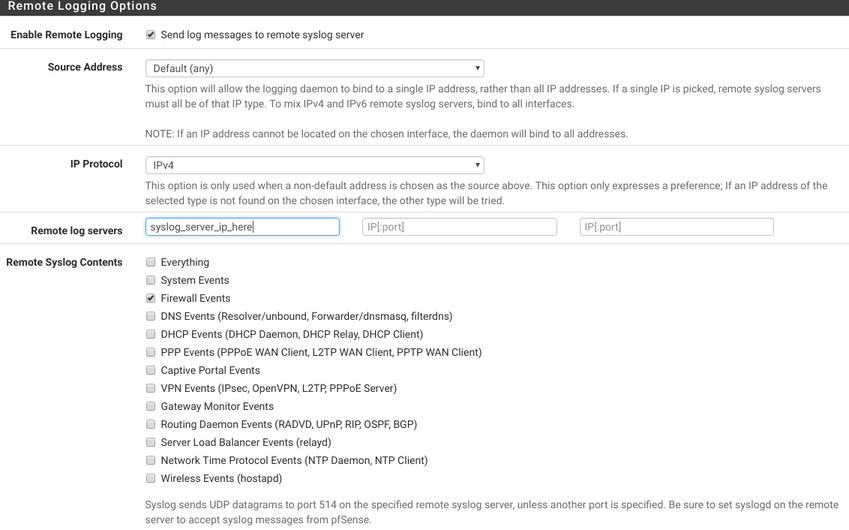
It utilizes rsyslog which is stable and behaves quite adequate.
Now parsing the logs on the Logstash end is a different story. I’ve done it and writing those grok files is pretty ugly but it is out of the scope for this post.
It can be done and it sort of works.
It’s not perfect because it logs only the IP header and the stuff it can do are solely based on the packet’s header fields - source_ip, dest_ip …
Unfortunately it does not log the packet body. This means that the only data you can see is basically where it’s coming from and where it’s headed to.
I’d like to know all about the traffic passing though my network and the headers do not suffice so the search for another solution solution continued.
But, but…
I’d really wanted to make use of the existing logging features that pfSense provides and avoid any unnecessary complications.
My guess is that underneath, logging is done via something tcpdump-like.
I gave it a try to see whether it really logs only header data or does it perform a full packet capture.
Running
# tcpdump -qni tun0 dst port 80 -w log.pcapin one shell, and
\$ curl testmyids.comin another resulted in the following pcap:
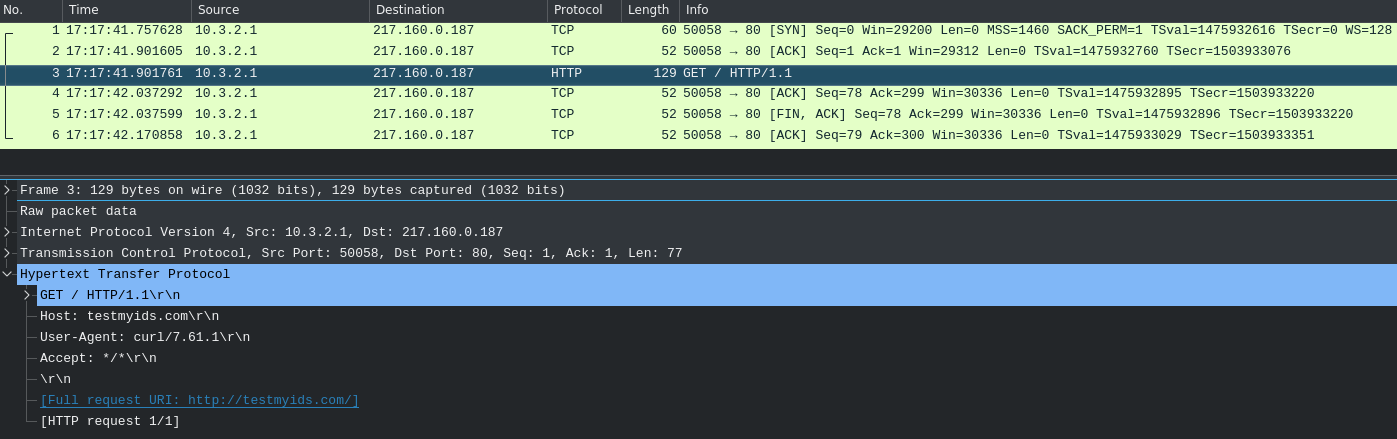
Obviously, tcpdump logs more than just headers.
So the pfSense logging issue should be a click away right?
Wrong!
Turns out that full packet capture is not supported out of the box. This means that if I want HTTP traffic I’ll have to install some web content filter, if I want dns traffic some dns filter…
That’s definitely a no-no so the hunt for a better solution continued.
An Elastic solution?
Newer versions of Security Onion come with the ELK stack as log processing backend.
There is this thing called Packetbeat which is an Elastic product whose purpose is to log network traffic and send it to Logstash for instance.
One solution would be to install packetbeat on every endpoint I’d like to monitor and then make Security Onion make sense of the packetbeat data.
It’s not the most elegant solution but I already had playbooks to install and setup packetbeat so it’s an okay-ish solution.
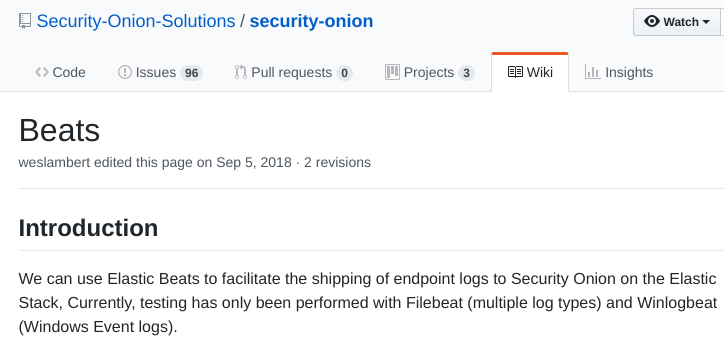
Unfortunately, when I started reading about integrating Security Onion with packetbeat, I was slapped in the face by the Security Onions’s documentation that says that the only supported *beats are Filebeat and Winlogbeat.
Dead end?
Things didn’t look great at this point. The neat and elegant solutions didn’t really work so next on the line was try something more network-y.
I had a little play with the configuration of the Security Onion appliance. When configuring it wants an interface to sniff traffic from. That’s an interface without and actual IP address assigned to it, just sitting there in promiscuous mode listening for traffic.
Back to the drawing board…
Let’s have a look at the network and try to come up with something smart.
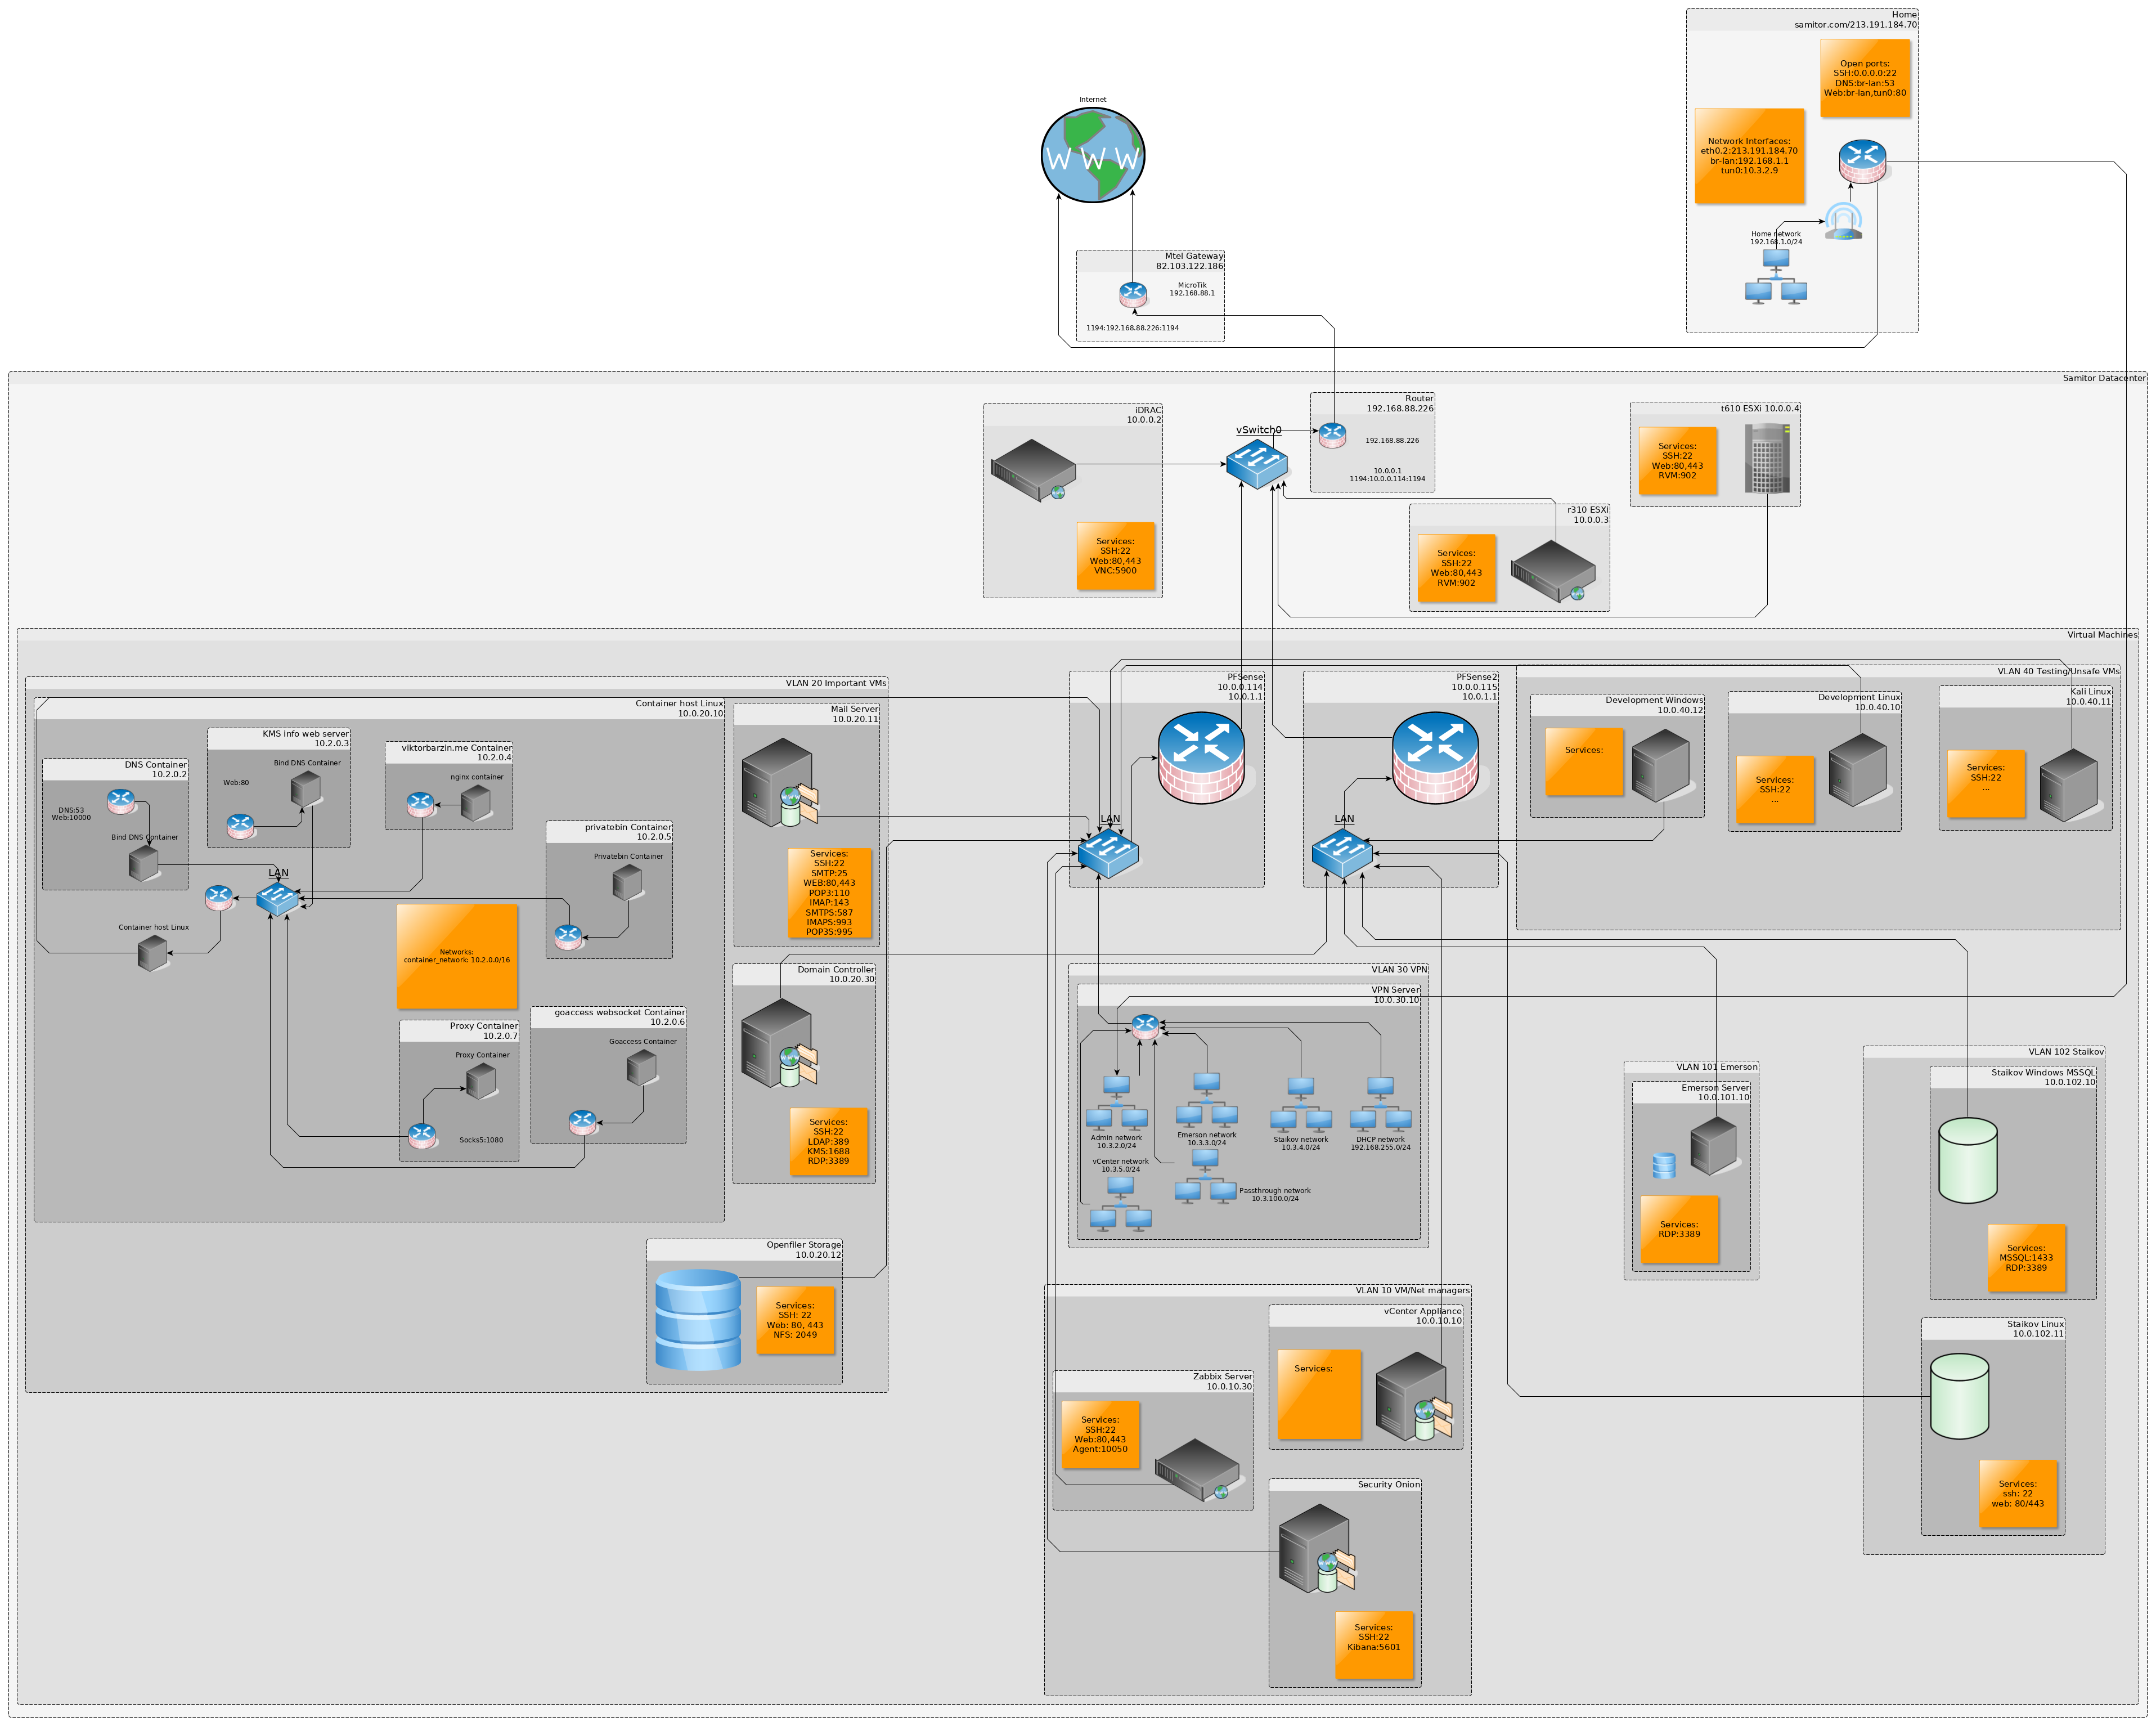
(open image in new tab for better quality)
The problem I had to solve was: Where should I put the monitoring appliance so that all the other VMs could send their traffic to the it, but at the same time they shouldn’t be able to directly communicate to it since that would be a security concern?

An option could be the following:
- At each host, setup some traffic copying software
- It would then forward a copy of each sent and received packet to the Security Onion appliance.
- I’ll have to add rules at the pfSense firewall to allow that traffic and it may work.
Definitely no - too much hassle, there must be an easier way.
Down the abstraction tree
Going closer to the bare metal, the next stop is the ESXi vSwitch. Wandering its settings, a particular one caught my attention - promiscuous mode:
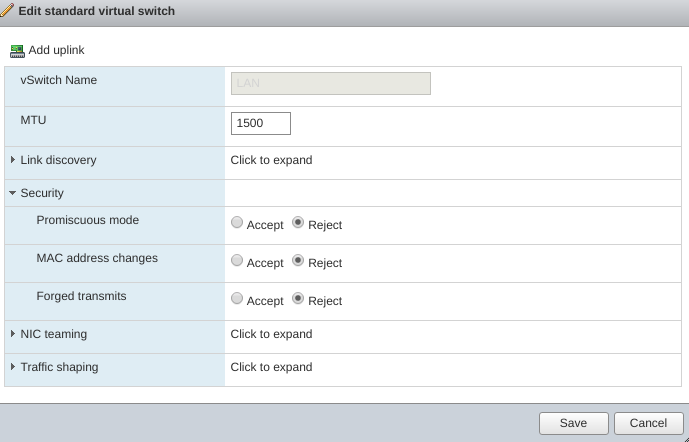
Doing a bit of reading on this setting, it turned out that if set, it makes the vSwitch act like a hub.(Plot twist incoming)
What’s more interesting is that this can be applied at the portgroup level!
So I could perhaps create a portgroup that acts like a hub?
Then it hit me
I came up with the following plan - create a bridge interface on the pfSense appliance, that would bridge all of the interfaces that I want to monitor. Create a new portgroup on the vSwitch that would act like a hub and add 2 members to it - the bridged interface from the pfSense and the other one would be the listening interface from the Security Onion appliance.
This way, all of the traffic would be basically broadcasted in a portgroup in which the only other member would be the Security Onion that would happily look at it all and do its thing.
That idea may be a bit hard to grasp especially if you’re a beginner in networking so I’ll throw in this picture because images always help:
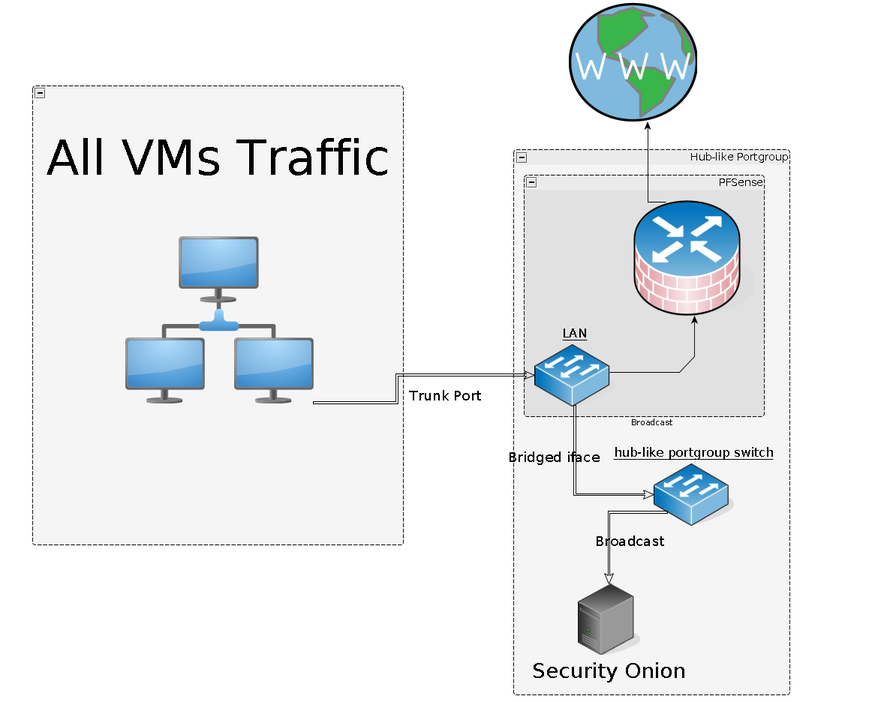
The main idea is to create a separate portgroup (think of it as a separate LAN) that will have only 2 members - the pfSense and the Security Onion’s sniffing interface. Then forward all of the traffic the pfSense sees to this portgroup. From then onwards, the Security Onion appliance would see all the packets as they are, without being changed at all!
Sounds like a plan!
Let’s build the picture above then.
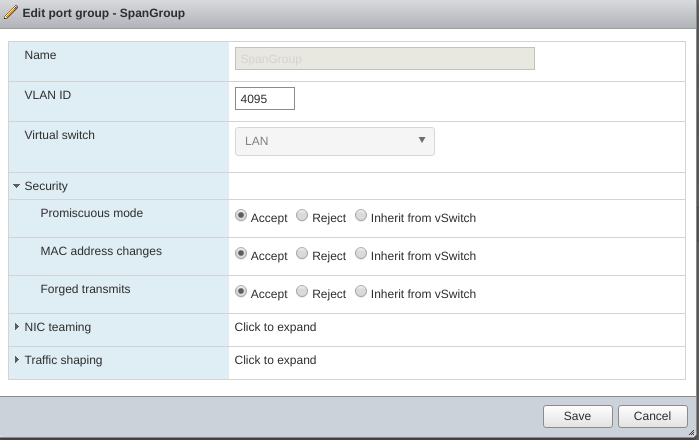
Firstly, let’s create the portgroup.
This is what it should look like:
The hidden options are not too important - just keep the defaults.
It is very important that the VLAN ID is set to 4095. This tells the vSwitch to create a portgroup that acts as a trunk group which would accept all VLAN traffic. Initially I had this to 0 and nothing was sent.
The other very important setting is the promiscuous mode - it needs to be accepted, otherwise the portgroup would act as a normal switch and we want it to behave like a hub.
Lastly, we need to add 2 network intefaces one to the pfSense VM and one to the Security Onion one. Both interfaces of course need to be connected to the portgroup we’ve just created.
pfSense bridging
Creating a bridge interface is done from Interfaces > Bridges. It is quite trivial, just select all the interfaces you want to be member of the bridge and then the important part is to choose the Span Port in the Advanced section.
The span sport should be the one that is member of the hub portgroup that we just made.
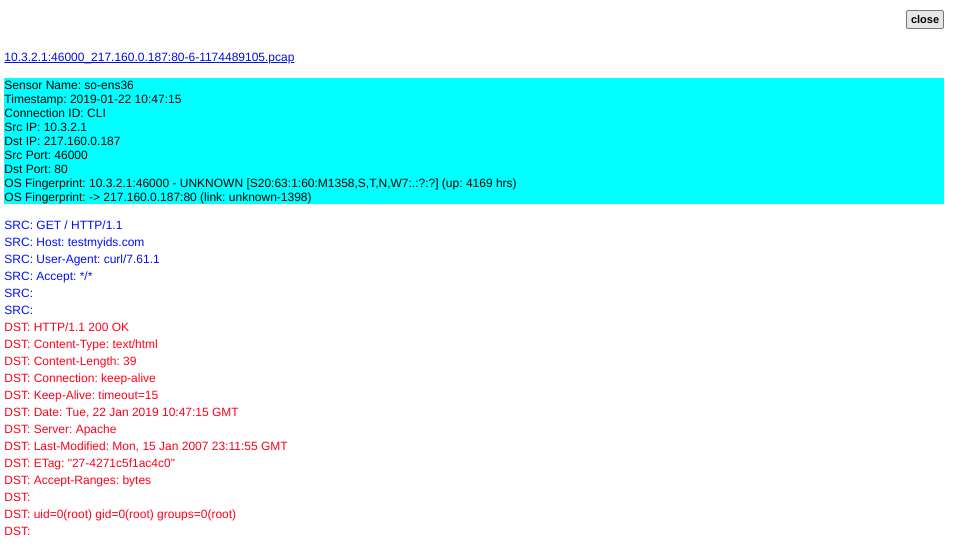
Aaaand success!
Logs started appearing.
What’s more I can see full data!
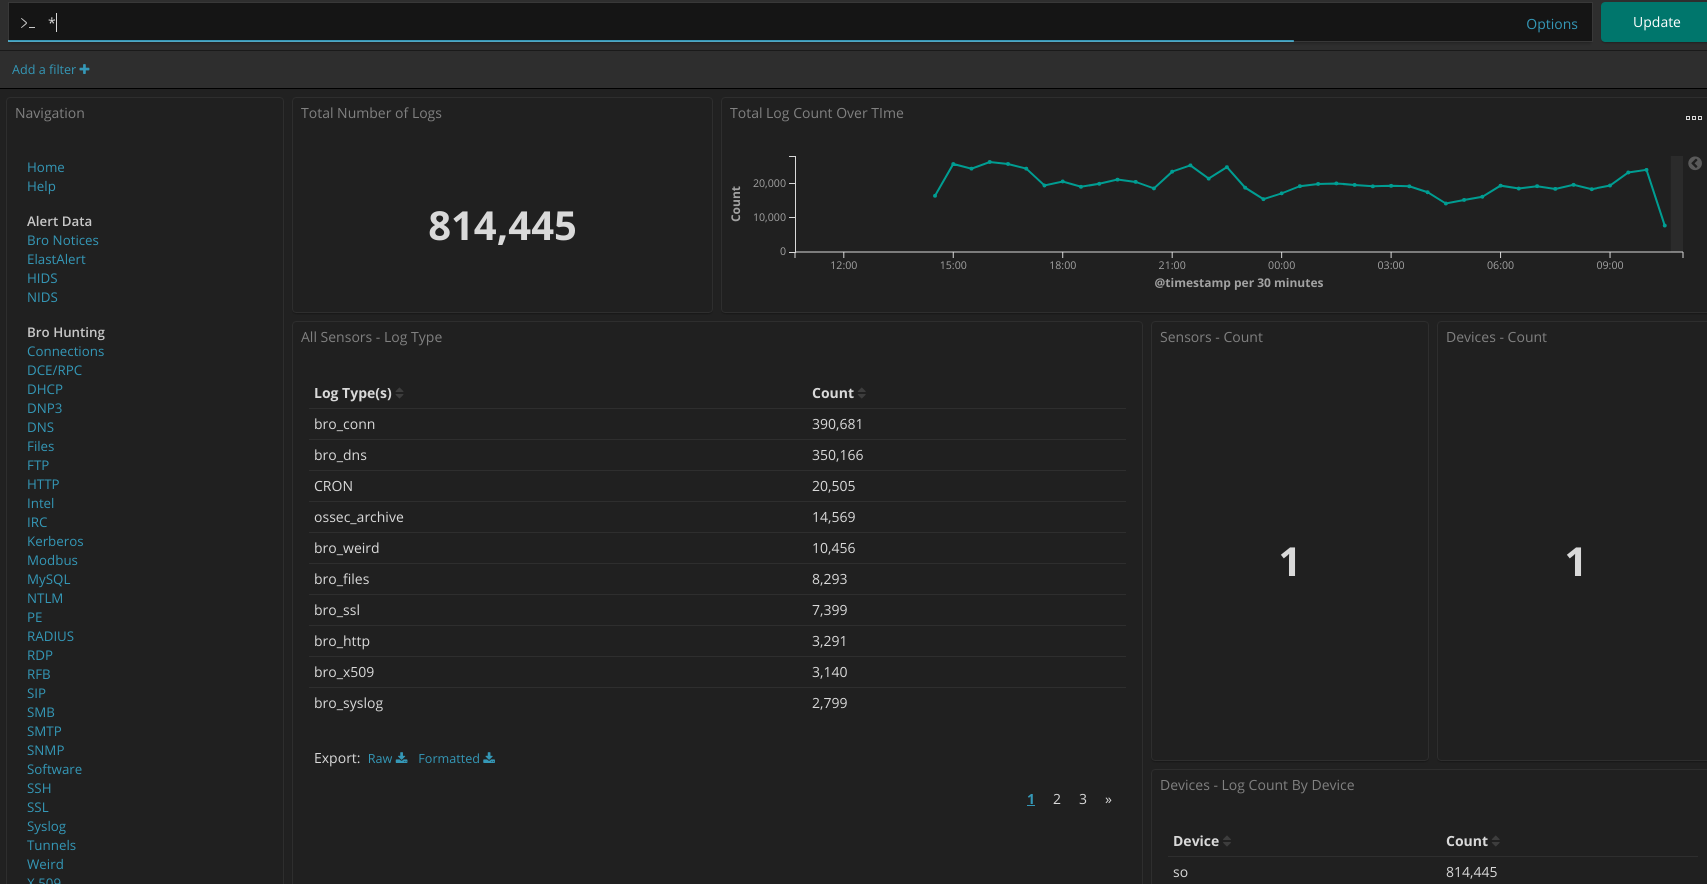
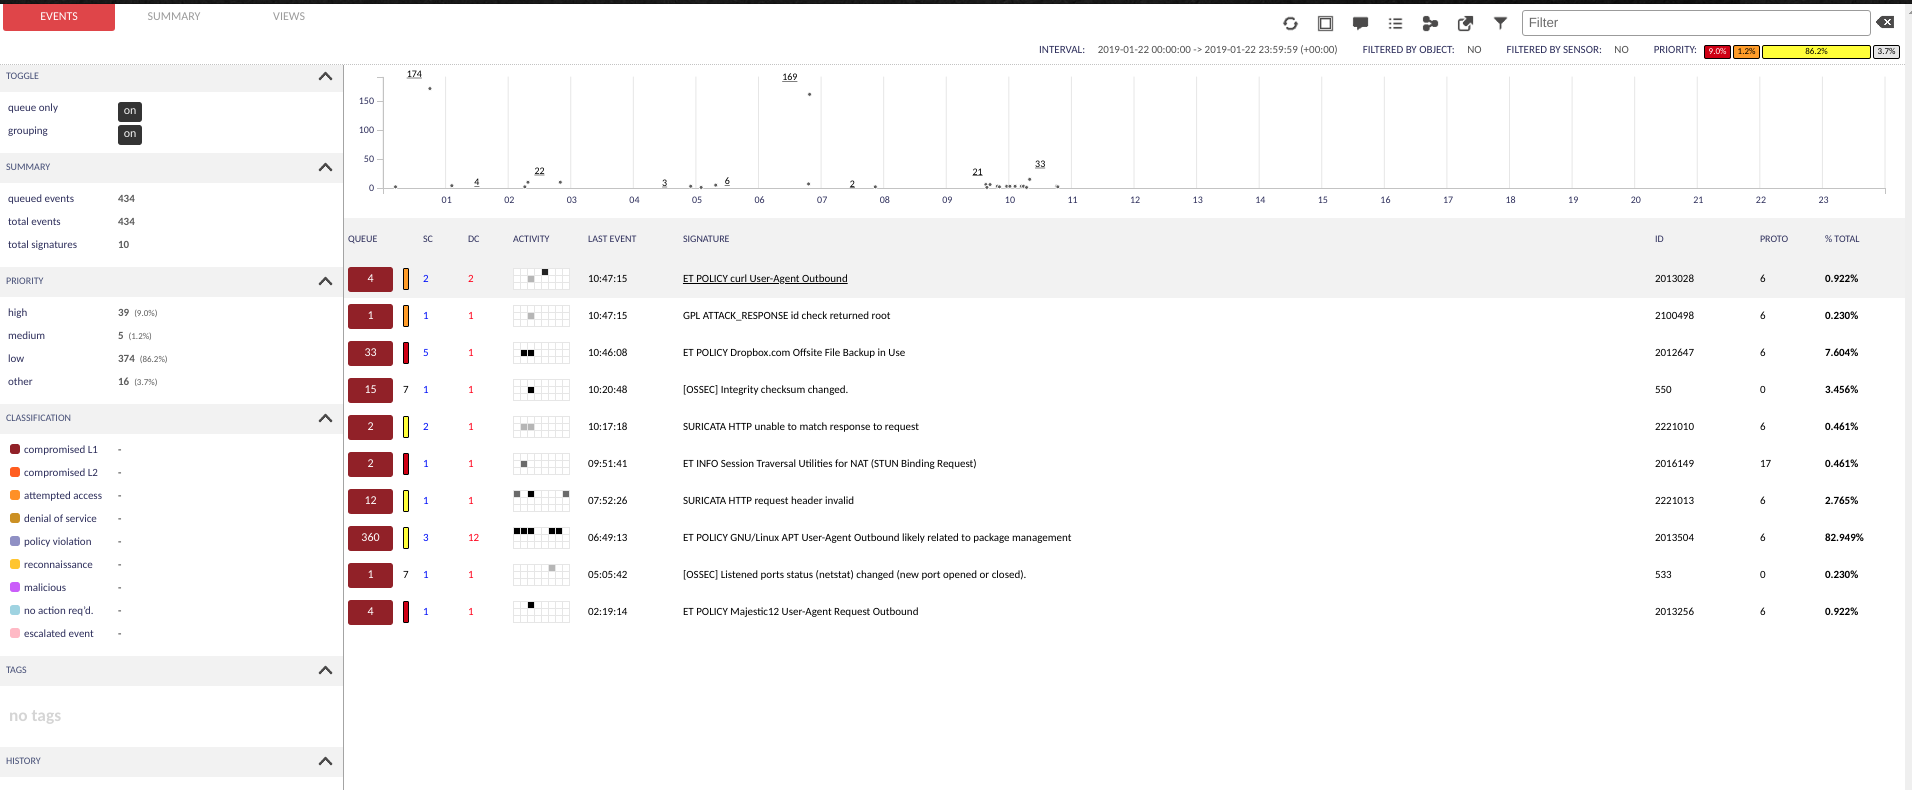
There’s plenty of data and analysis to do with Squert:
There is also plenty of stuff to play with in Kibana as well as there’s tons of data.
If you’re interested to see what’s happening in your network, I recomment setting up a Security Onion instance and tinker around with the tools it provides:
Analyst Tools
Network Visibility
Caveats
Before closing off, I was interested to learn more about how that bridging thing exactly work, because it behaved a bit dodgy.
I started messing with pfSense’s span port and I found out that it wasn’t actually needed.
Yes! The Security Onion appliance kept receiving traffic even when pfSense was not sending data to it!

How did it keep receiving traffic if it wasn’t connected to the pfSense???
Where was this traffic coming from then?
I deleted the bridge interface and removed the additional network interface I had added to the pfSense appliance, but that still didn’t stop the traffic to the Security Onion(SO) appliance.
I pondered quite hard at this for some time. I started debugging from the ground up - disconnecting the monitoring interface on the SO VM seemed to cut the traffic so that’s something. Disabling the promiscuous mode on the portgroup also seems to have the same effect so the solution must be somewhere in here!
Remember that piece of documentation I linked to earlier? Well I had a second read at it and it all made sense:
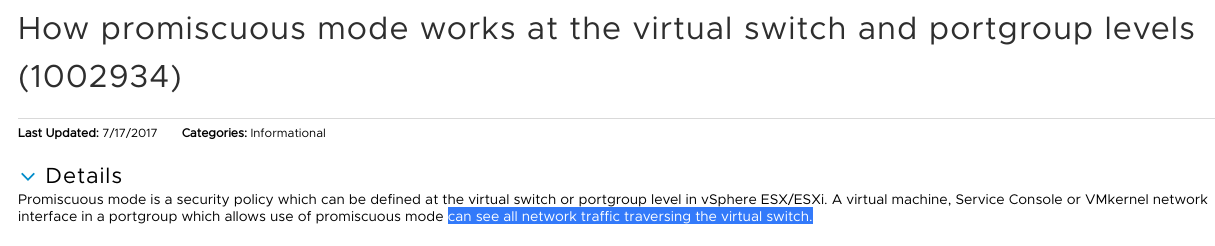
My understanding of how the promiscuous mode works was wrong!
A portgroup that has promiscuous mode enabled not only sees everyone else’s traffic in that portgroup, but also everyone else’s traffic on that vSwitch! So being part of this portgroup, the SO appliance can see everyone’s traffic regardless of whether it is connected to the pfSense or not.
Conclusion
The Security Onion appliance is a huge playground that I’m having a go at. Setting it up in my environment was quite fun especially debugging the networking issues.
If you’d like to have a deeper insight on how networks work in general and what’s more, what communicates with what in your own environment, I recommend setting up a Security Onion instance yourself and give it a go!